Using the Dashboard
DeepMod provides an intuitive interface for managing your content moderation policies, monitoring results, and collaborating with your team. This section walks you through each area of the dashboard and how to use them effectively.
Dashboard Navigation
The main navigation sidebar provides quick access to all key areas of your moderation system. Each section serves a specific purpose in your content moderation workflow.
Navigation Overview:
-
My Policies: Create, manage, and monitor your content moderation policies
-
Rule Presets: Access pre-built rule templates or create your own to accelerate policy creation
-
Tags: Organize and categorize your moderation runs
-
Analytics: View moderation performance and detailed run histories
-
Notifications: Stay updated on system events and usage alerts (displays unread count badge)
-
Org Settings: Manage team members, API tokens, and organization configuration
Policies Section
The Policies section is your central hub for creating and managing content moderation policies. This is where you'll spend most of your time when setting up and refining your moderation approach.
Policy Overview Grid
The main policies page displays all your policies in a responsive grid layout. Each policy card shows essential information at a glance:
-
Policy Name and Description: Quick identification of each policy's purpose
-
Status Indicator: Visual confirmation of whether policies are active or inactive
-
Quick Actions: Toggle status, edit, or delete policies directly from the card
-
Rule Count: See how many rules each policy contains
Policy Search and Filtering
Use the search bar at the top of the policies section to quickly locate specific policies by name or description. This becomes essential as your policy library grows and you manage multiple content moderation scenarios.
Creating and Editing Policies
Click the "New Policy" floating action button to create a new policy, or click "Edit" on any existing policy card to modify it. The policy form slides in from the right, allowing you to:
-
Set the policy name and description
-
Configure confidence thresholds
-
Choose review modes (No Review or Human Review)
-
Assign webhook endpoints for result delivery
Policy Builder
The Policy Builder provides a visual canvas interface for constructing your moderation logic. This visual editor makes it easy to understand and modify complex policies.
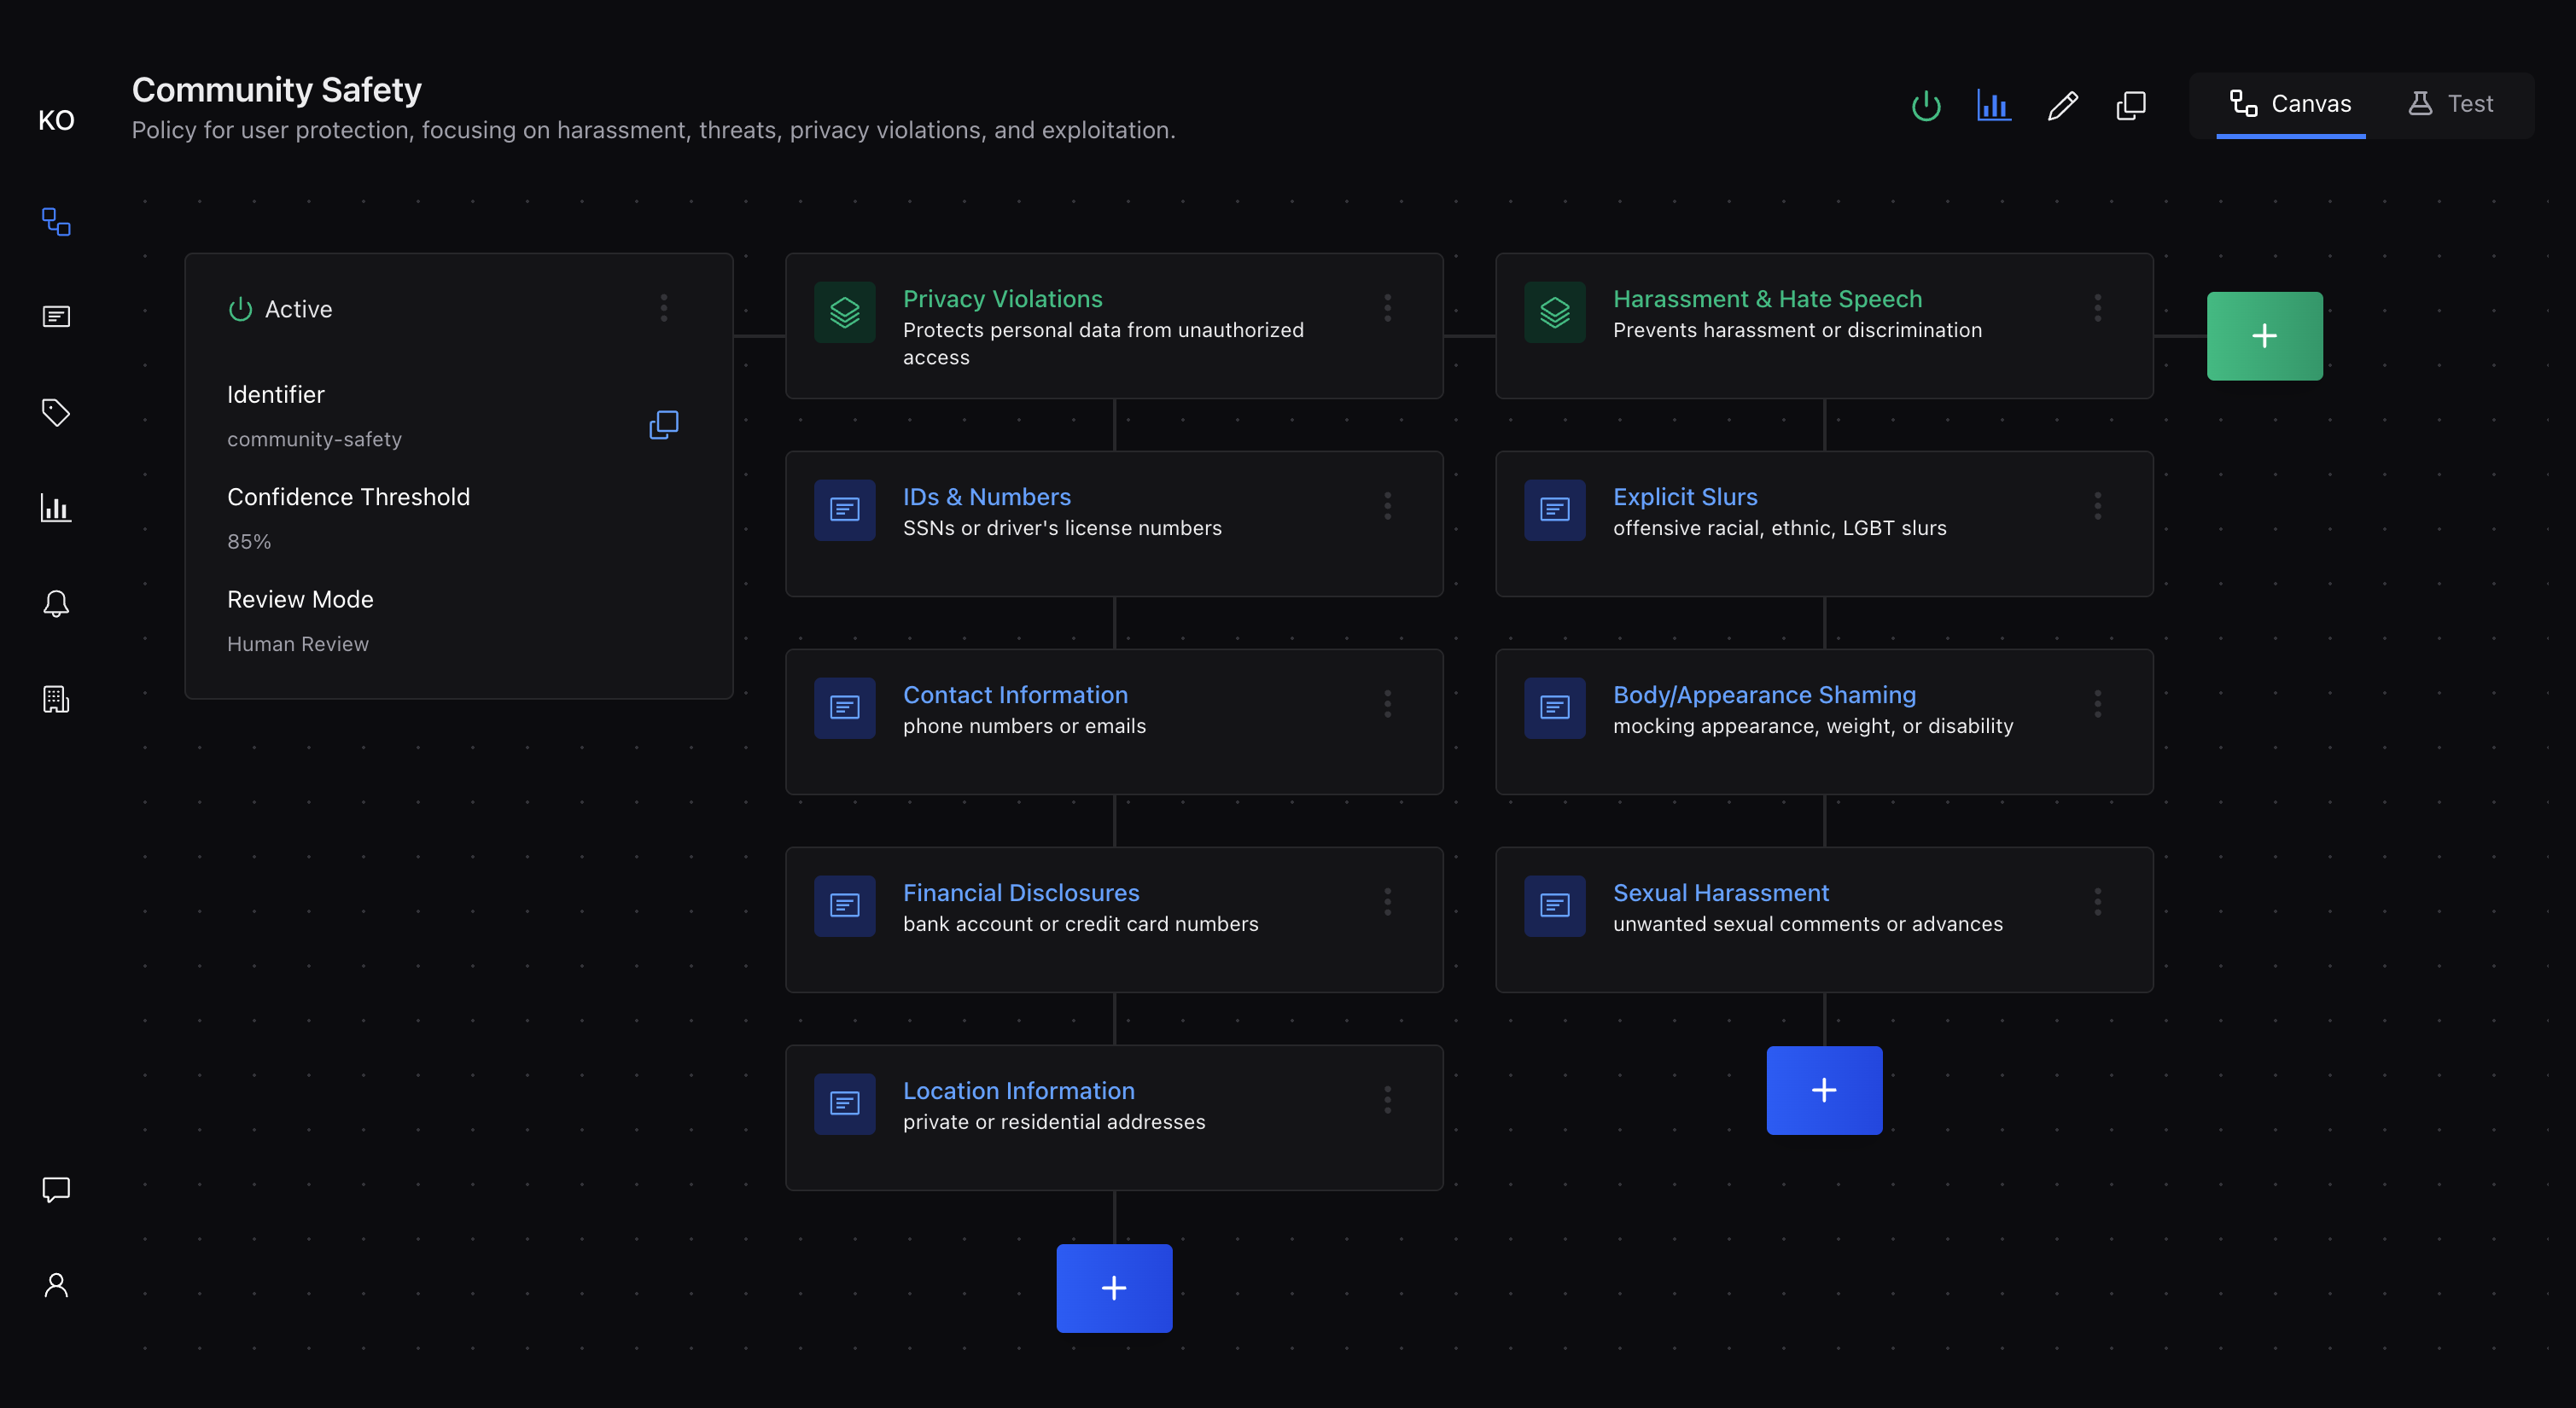
Policy Settings Card
The settings card on the left displays your policy's core configuration:
-
Status Toggle: Activate or deactivate policies instantly
-
Confidence Threshold: Adjust sensitivity with a visual slider
-
Review Mode: Switch between automated and human review modes
Note: Webhook configuration is managed at the organization level in Org Settings, not within individual policies.
Rule Group Management
Adding Rule Groups: Click the "Add Rule Group" button to create logical containers for related rules. Common patterns include Safety, Legal, Brand, and Spam groups.
Organizing Groups: Rule groups appear as connected cards in the visual flow, making it easy to understand how your policy is structured and how rules relate to each other.
Rule Creation
Within each rule group, you can add individual rules that define specific content requirements:
Rule Interface: Each rule has a name field for quick identification and a content field for the detailed requirement description.
Rule Management: Edit existing rules by clicking on them, or delete rules that are no longer needed. The visual interface makes it easy to see which rules belong to which groups.
Policy Testing
The Policy Testing interface allows you to validate your policy behavior before activating it for production use. This iterative testing approach helps ensure your policies perform as expected.
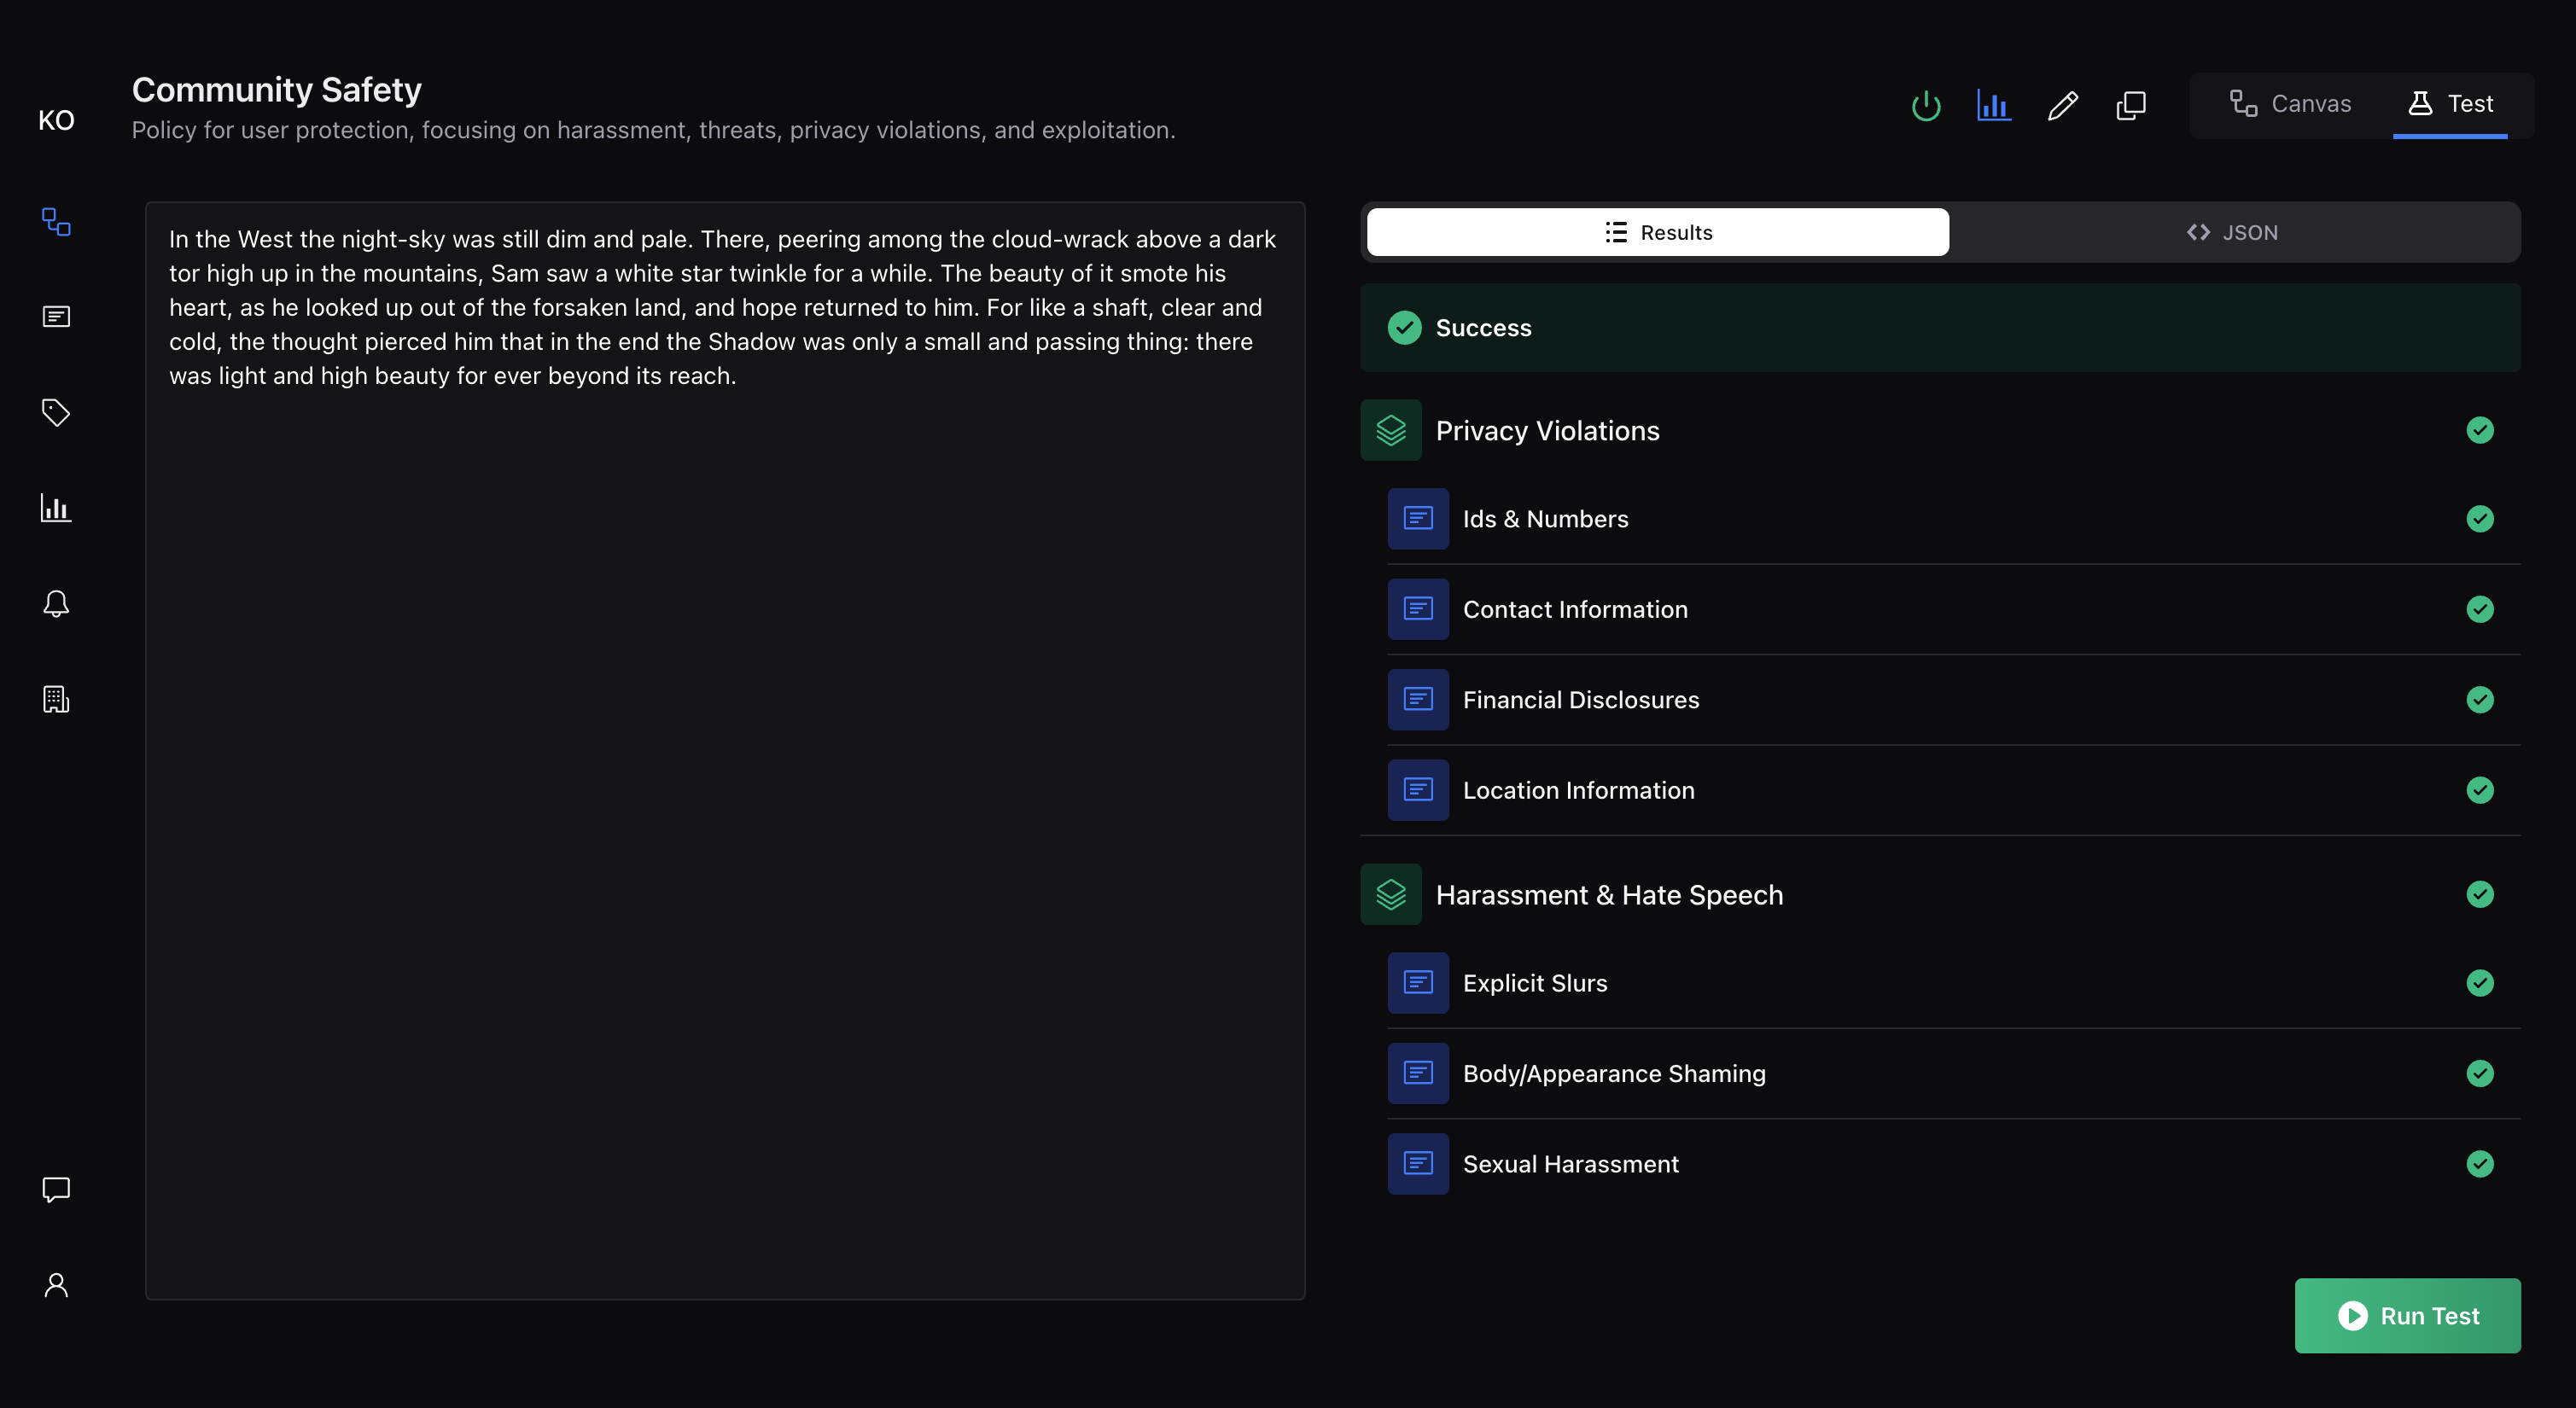
Testing Workflow
Content Input: Paste or type content into the large text area on the left side of the testing interface. You can test with any length of content up to system limits.
Instant Results: Click "Run Test" to immediately evaluate your content against the policy. Results appear on the right side in both human-readable and JSON formats.
Results Analysis: The results panel shows:
-
Overall decision (Success, Failure, or Ambiguous)
-
Rule-by-rule breakdown with confidence scores
-
Detailed reasoning for each decision
-
Complete JSON response for API integration reference
Iterative Refinement
Use the testing interface to refine your policies through multiple iterations:
-
Test content that should clearly pass or fail
-
Examine edge cases and borderline content
-
Adjust rules or confidence thresholds based on results
-
Re-test with the same content to validate improvements
Analytics and Moderation Queue
The Analytics section serves as both your moderation queue and performance monitoring center. This unified view helps you understand both individual moderation runs and overall system performance.
Usage Summary
At the top of the analytics page, the usage summary displays in a two-panel layout:
Left Panel - Key Metrics:
-
Completed Runs: Total number of moderation evaluations this billing period
-
Remaining Credits: Available credits from your plan's monthly allowance
-
Monthly Credits: Your plan's total monthly credit limit
Percentage Cards:
-
Successful: Percentage (and count) of content that passed moderation
-
Failed: Percentage (and count) of content that violated policies
-
Ambiguous: Percentage (and count) of content requiring human review
-
Reviews: Percentage (and count) of runs that received human review
Right Panel - Trend Chart:
A 3-month historical area chart showing the distribution of successful, failed, and ambiguous runs over time.
Advanced Filtering
The analytics interface provides powerful filtering options to segment your moderation data:
Policy Filter: Select a specific policy or view all policies combined
Status Filter: Focus on specific statuses:
-
Pending Review
-
Completed
-
All Statuses
Reviewer Filter: See runs by review status:
-
Specific team members
-
Not Reviewed
-
All Reviewers
Tag Filter: Multi-select tags using a searchable dropdown with colored chips to filter runs by custom tags you've applied
Refresh Button: Click the sync icon to manually refresh usage stats and moderation data
Moderation Runs Table
The main table displays detailed information about each moderation run with the following columns (in order):
|
Column |
Description |
|---|---|
|
Policy |
Which policy evaluated the content |
|
Credits |
Number of credits consumed by this run |
|
Result |
Success, Failure, or Ambiguous outcome (shows review result if reviewed) |
|
Date |
When the moderation occurred |
|
Status |
Current review status (Pending Review or Completed) |
|
Reviewed By |
Team member who handled human review, or "--" if not reviewed |
|
Mode |
Type of moderation performed (default, test, etc.) |
Click any row to open a slideover panel with detailed results, original content, and metadata.
Pagination: Navigate through results using the pagination controls at the bottom of the table.
Human Review Workflows
When policies are configured for human review, the analytics interface becomes your review management center.
Review Queue Management
Pending Reviews: Filter to show only runs requiring human attention
Team Access: Team members can access and complete pending reviews
Priority Management: Handle high-priority or time-sensitive content first
Review Interface
When reviewing ambiguous cases, team members can:
-
View Original Content: See exactly what was submitted for moderation
-
Understand AI Reasoning: Review why the content was flagged as ambiguous
-
Make Final Decisions: Choose Success or Failure based on manual review (with granular per-rule decisions)
-
Add Review Notes: Document reasoning for audit trails and team learning
Review Tracking
Monitor review performance and maintain quality standards:
-
Turnaround Times: Track how quickly reviews are completed
-
Reviewer Activity: See which team members are handling reviews
-
Decision Patterns: Identify trends in human review outcomes
Organization Settings
The Organization Settings section provides administrative controls for managing your team, API access, webhooks, and billing.
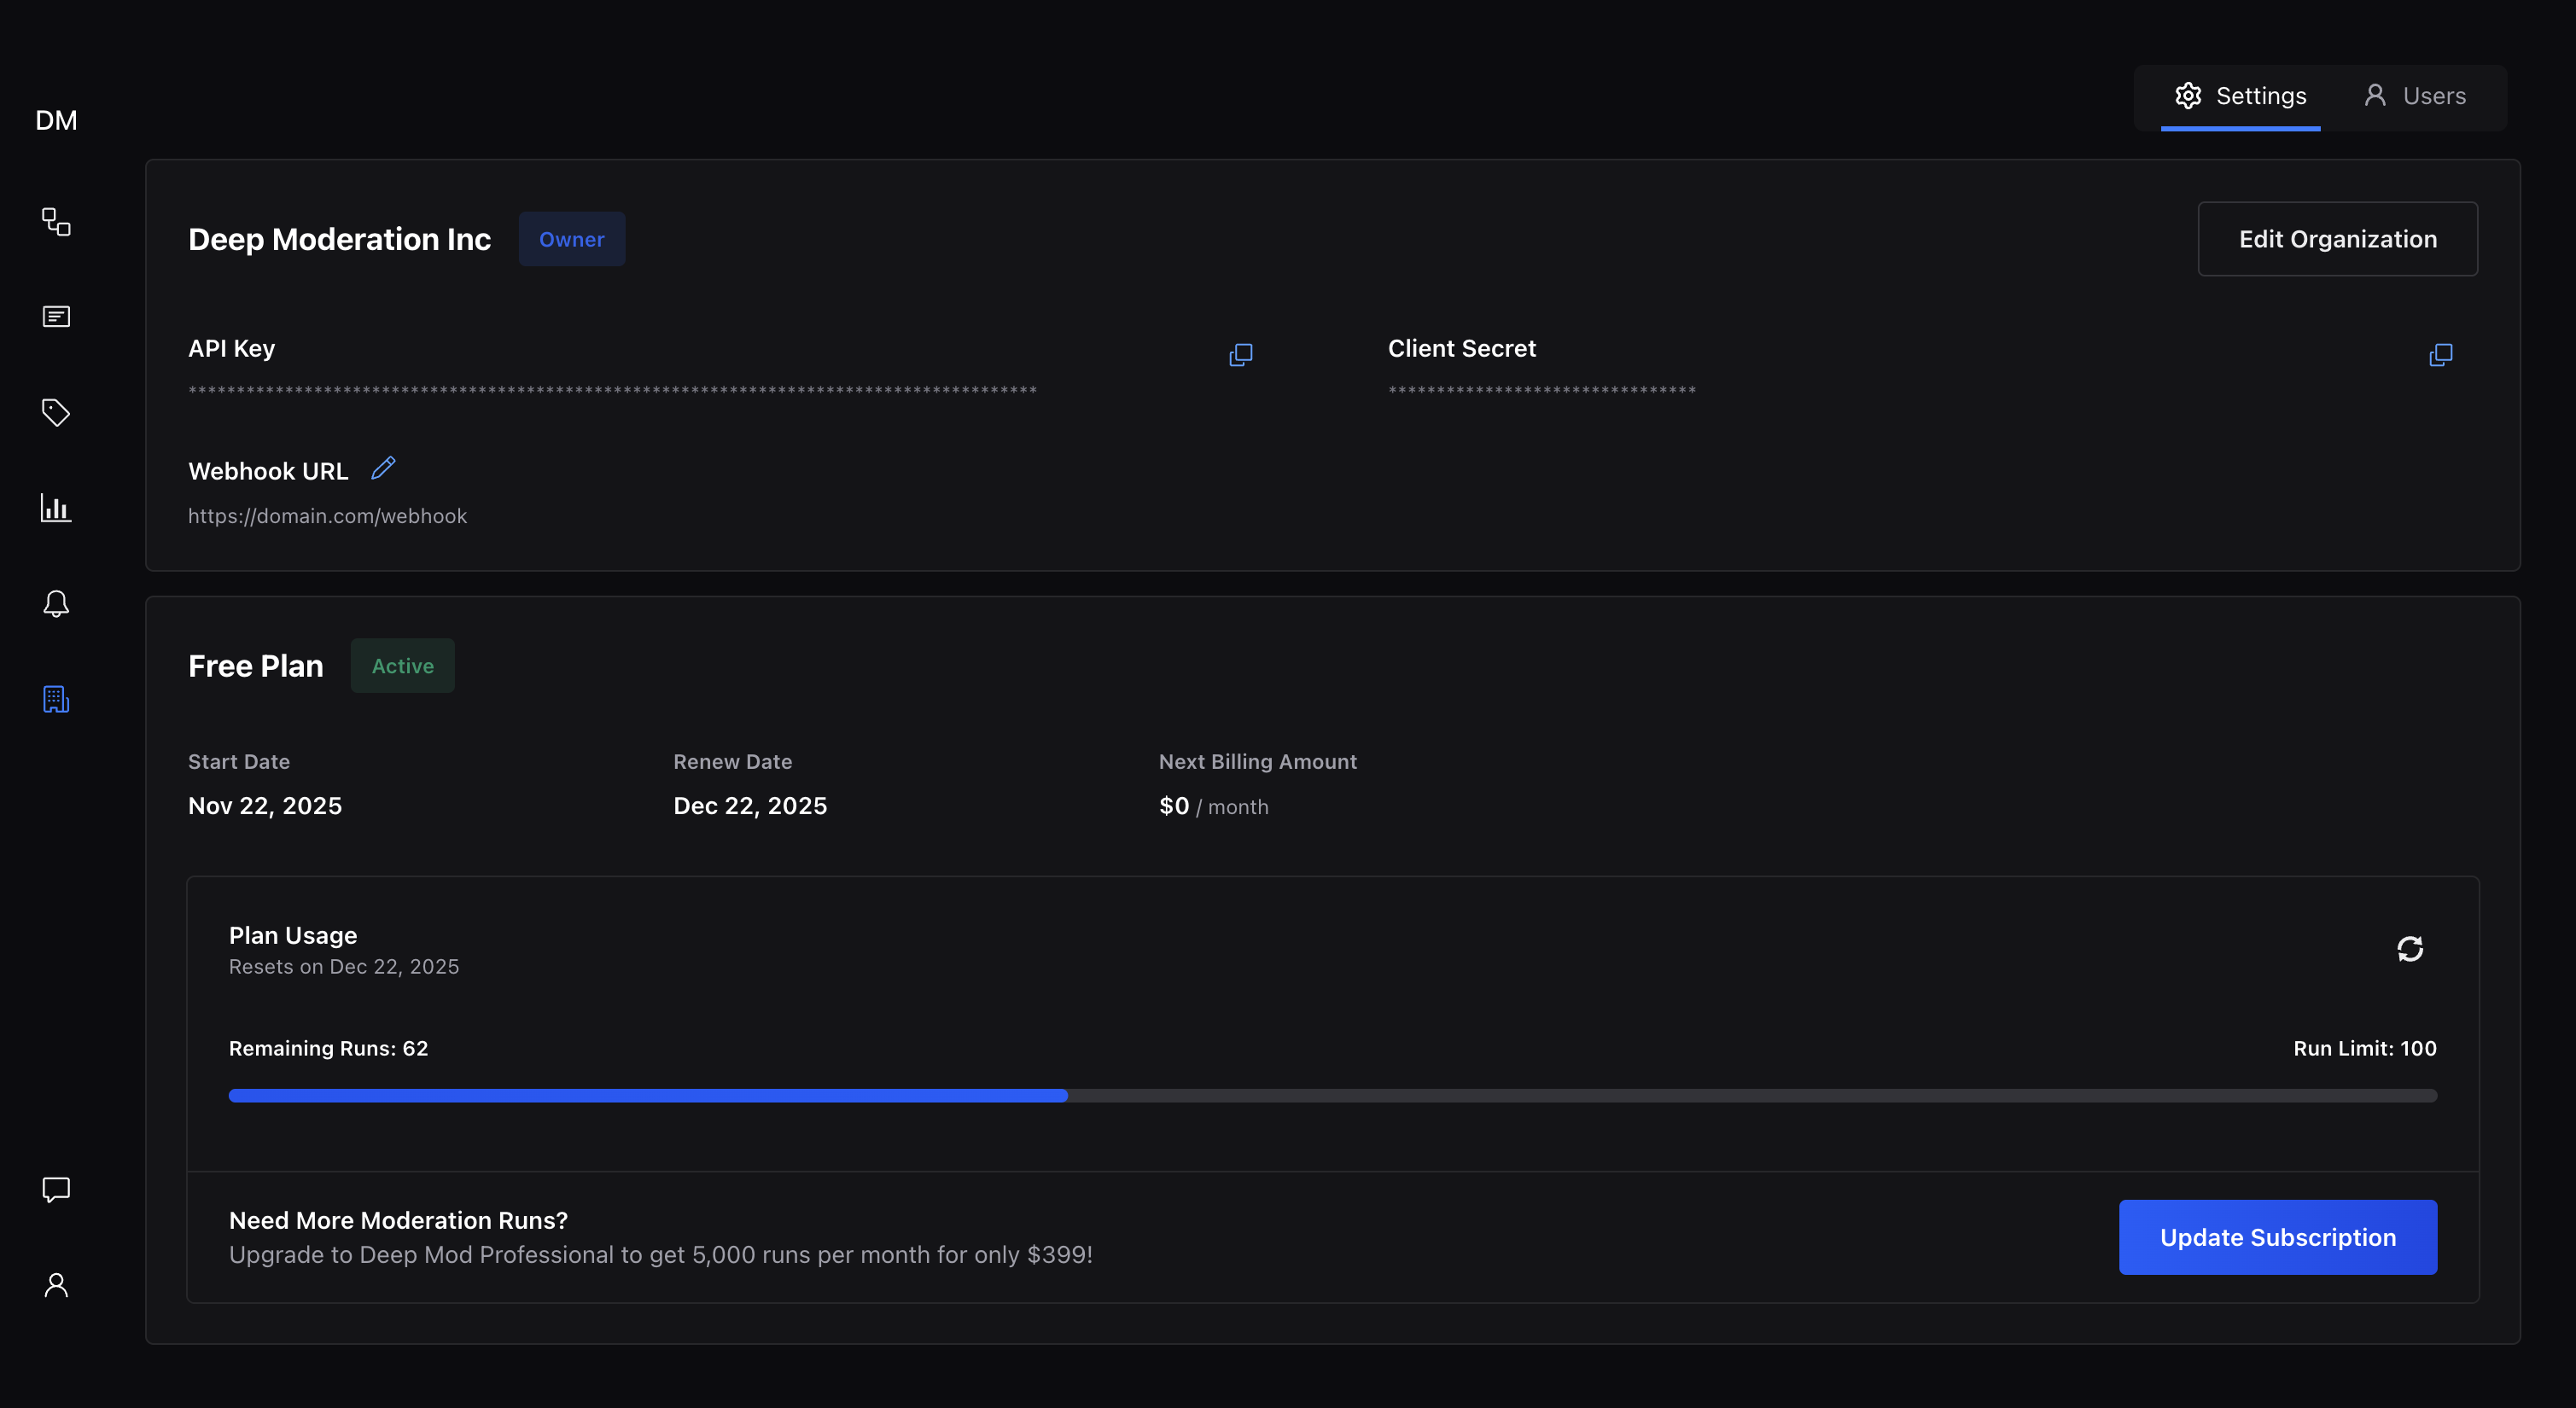
API Key Management
Token Display: View your organization's API token for programmatic integration
Access Control: Ensure only authorized team members have access to API credentials
Webhook Configuration
Configure organization-level webhooks for receiving moderation results:
-
Set the webhook URL endpoint
-
Test webhook connectivity
-
Manage webhook authentication
Team Management
Member Invitations: Invite new team members via email with appropriate role assignments
Role Management: Assign Admin, Moderator, or Member roles based on responsibilities
Access Review: Monitor who has access to your organization and their activity levels
Subscription Management
Current Plan: View your active subscription tier and included features
Usage Tracking: Monitor credit consumption against your plan limits
Billing History: Access invoices and payment information
Plan Changes: Upgrade or modify your subscription as your needs evolve
What's Next
Now that you understand the dashboard interface, explore these advanced topics:
-
Running Moderation Effectively - Learn techniques for scaling and optimizing your moderation workflows
-
Interpreting Results - Deep dive into understanding moderation outcomes and making data-driven improvements
-
Human Review Workflows - Advanced strategies for managing human oversight efficiently
-
Policy Authoring Best Practices - Expert techniques for creating robust, maintainable policies
The dashboard provides everything you need to manage content moderation effectively. Focus on the sections most relevant to your role, and gradually explore advanced features as your moderation needs evolve.
Dashboard questions or issues? The interface is designed to be intuitive, but contact our support team if you need help navigating any section or accessing specific features.